


Trusted by over 15 Million Traders
The Most Awarded Broker
for a Reason
Easy Access to 1,400+ Global Assets
EURUSD
Euro vs U.S. Dollar
US500
S&P 500 (US500)
GOLD
Gold
COFFEE
US Coffee
Apple
Apple (AAPL.OQ)
-

Finance Magnates 颁发
-

Finance Magnates 颁发
-

Capital Finance International Magazine (CFI.co) 2024年颁赠
-

COLWMA 2024年颁赠
-

荣获World Finance Forex Awards 2023最佳外汇客户服务奖
-

荣获World Finance Forex Awards 2023欧洲最佳外汇经纪商奖
-

荣获World Finance Forex Awards 2023澳大拉西亚最佳外汇经纪商奖
-

荣获World Finance Forex Awards 2023拉丁美洲最佳外汇经纪商奖
-

荣获World Finance Forex Awards 2023中东最佳外汇经纪商奖
-

CFI.co于2023年颁赠
-

荣获2023年City of London Wealth Management Awards
-

荣获2022年埃及金融博览会颁赠
-

荣获2022年City of London Wealth Management Awards
-

CFI.co于2022年颁赠
-

荣获Global Forex Awards 2022 — 零售外汇 颁赠
-
2021年迪拜外汇博览会获颁赠
-

Ultimate Fintech 2021年颁赠
-

荣获2021年City of London Wealth Management Awards
-

FX168于2020年12月颁赠
-

荣获Global Business Awards 2020
-

荣获2020年City of London Wealth Management Awards
-

Capital Finance International Magazine (CFI.co)颁赠
-

Capital Finance International Magazine (CFI.co)颁赠
-

荣获2019年City of London Wealth Management Awards
-

Shares Magazine 授予 UK Forex Awards 2018
-

Capital Finance International Magazine (CFI.co)颁赠
-

Capital Finance International Magazine (CFI.co)颁赠
-

2017年伦敦财富管理奖
-

2016最佳本土 客户服务
-

中东和北非地区(MENA)增长最快的经纪商
-
2015年最佳外汇科技提供商
-
2014年最佳外汇科技提供商
-

2014年最佳外汇科技提供商
-

荣获 The Trading Show 2024年非洲 Africa Fintech 峰会颁赠
-

荣获2024年中东地区 Brokersview 颁赠
-
荣获2024年中东地区 Brokersview 颁赠
-

荣获2024年阿曼 Smart Vision 峰会颁赠
-

荣获2024年迪拜外汇博览会颁赠
-

荣获2024年迪拜 Forex Traders Summit 颁赠
-

2024年埃及 Smart Vision 峰会颁赠
-

投查查于2024年颁赠
-

Capital Finance International Magazine (CFI.co) 2024年颁赠
-

CFI.co于2023年颁赠
-

CFI.co于2023年颁赠
-

交易社区平台FOLLOWME于2022年颁赠
-
2022年迪拜Forex Expo获颁赠
-
2022年迪拜Forex Expo获颁赠
-

荣获Global Forex Awards 2022 — 零售外汇 颁赠
-

CFI.co于2022年颁赠
-

CFI.co于2022年颁赠
-

World Finance Forex Awards 2022 颁发
-

World Finance Forex Awards 2022 颁发
-

World Finance Forex Awards 2022 颁发
-

World Finance Forex Awards 2022 颁发
-
交易社区平台FOLLOWME于2021年颁赠
-

2021年埃及Smart Vision Investment Expo博览会获颁赠
-

CFI.co于2021年颁赠
-

CFI.co于2021年颁赠
-

荣获Global Forex Awards 2021 — 零售外汇 颁赠
-

荣获Global Forex Awards 2021 — 零售外汇 颁赠
-

World Finance 2021颁发
-

World Finance 2021颁发
-
FOLLOWME于2021年颁赠
-

Global Forex Awards 2021 — B2B 颁赠
-

Global Forex Awards颁赠
-

Global Forex Awards颁赠
-

CFI.co于2020年颁赠
-

CFI.co于2020年颁赠
-

荣获Global Business Awards 2020
-

World Finance Magazine 颁赠
World Finance Forex Awards 2020 -

World Finance Magazine 颁赠
World Finance Forex Awards 2020 -
FOLLOWME交易社区授予
-

Global Forex Awards颁赠
-

Global Forex Awards颁赠
-

FinTech Age Awards颁发
-

World Finance Magazine 颁赠
World Finance Forex Awards 2019 -

World Finance Magazine 颁赠
World Finance Forex Awards 2019 -

荣获 World Finance Forex Awards 2018 颁赠
-

荣获2018年埃及金融博览会颁赠
-

荣获 Shares Magazine 的 UK Forex Awards 2017 颁赠
-

荣获 World Finance Forex Awards 2017
-

2016年最佳黄金经纪商
-

2016年最佳外汇经纪商
-

2015年最佳本地客户服务
-

Global Brands Magazine 颁赠
-

Online Money Awards 2022 颁发
-

荣获2022年埃及金融博览会颁赠
-

2015最佳外汇交易平台
-

2015最佳金融交易平台
-

2013最佳创新外汇平台奖
-

2020年 Cyprus HR Awards 颁赠
-

金融行业的佼佼者
-

认证最优金牌级别
-

2014年首届亚军
-
Finance Magnates 颁发
-
Finance Magnates 颁发
-
Capital Finance International Magazine (CFI.co) 2024年颁赠
-
COLWMA 2024年颁赠
-
荣获World Finance Forex Awards 2023最佳外汇客户服务奖
-
荣获World Finance Forex Awards 2023欧洲最佳外汇经纪商奖
-
荣获World Finance Forex Awards 2023澳大拉西亚最佳外汇经纪商奖
-
荣获World Finance Forex Awards 2023拉丁美洲最佳外汇经纪商奖
-
荣获World Finance Forex Awards 2023中东最佳外汇经纪商奖
-
CFI.co于2023年颁赠
-
荣获2023年City of London Wealth Management Awards
-
荣获2022年埃及金融博览会颁赠
-
荣获2022年City of London Wealth Management Awards
-
CFI.co于2022年颁赠
-
荣获Global Forex Awards 2022 — 零售外汇 颁赠
-
2021年迪拜外汇博览会获颁赠
-
Ultimate Fintech 2021年颁赠
-
荣获2021年City of London Wealth Management Awards
-
FX168于2020年12月颁赠
-
荣获Global Business Awards 2020
-
荣获2020年City of London Wealth Management Awards
-
Capital Finance International Magazine (CFI.co)颁赠
-
Capital Finance International Magazine (CFI.co)颁赠
-
荣获2019年City of London Wealth Management Awards
-
Shares Magazine 授予 UK Forex Awards 2018
-
Capital Finance International Magazine (CFI.co)颁赠
-
Capital Finance International Magazine (CFI.co)颁赠
-
2017年伦敦财富管理奖
-
2016最佳本土 客户服务
-
中东和北非地区(MENA)增长最快的经纪商
-
2015年最佳外汇科技提供商
-
2014年最佳外汇科技提供商
-
2014年最佳外汇科技提供商
-
荣获 The Trading Show 2024年非洲 Africa Fintech 峰会颁赠
-
荣获2024年中东地区 Brokersview 颁赠
-
荣获2024年中东地区 Brokersview 颁赠
-
荣获2024年阿曼 Smart Vision 峰会颁赠
-
荣获2024年迪拜外汇博览会颁赠
-
荣获2024年迪拜 Forex Traders Summit 颁赠
-
2024年埃及 Smart Vision 峰会颁赠
-
投查查于2024年颁赠
-
Capital Finance International Magazine (CFI.co) 2024年颁赠
-
CFI.co于2023年颁赠
-
CFI.co于2023年颁赠
-
交易社区平台FOLLOWME于2022年颁赠
-
2022年迪拜Forex Expo获颁赠
-
2022年迪拜Forex Expo获颁赠
-
荣获Global Forex Awards 2022 — 零售外汇 颁赠
-
CFI.co于2022年颁赠
-
CFI.co于2022年颁赠
-
World Finance Forex Awards 2022 颁发
-
World Finance Forex Awards 2022 颁发
-
World Finance Forex Awards 2022 颁发
-
World Finance Forex Awards 2022 颁发
-
交易社区平台FOLLOWME于2021年颁赠
-
2021年埃及Smart Vision Investment Expo博览会获颁赠
-
CFI.co于2021年颁赠
-
CFI.co于2021年颁赠
-
荣获Global Forex Awards 2021 — 零售外汇 颁赠
-
荣获Global Forex Awards 2021 — 零售外汇 颁赠
-
World Finance 2021颁发
-
World Finance 2021颁发
-
FOLLOWME于2021年颁赠
-
Global Forex Awards 2021 — B2B 颁赠
-
Global Forex Awards颁赠
-
Global Forex Awards颁赠
-
CFI.co于2020年颁赠
-
CFI.co于2020年颁赠
-
荣获Global Business Awards 2020
-
World Finance Magazine 颁赠
World Finance Forex Awards 2020 -
World Finance Magazine 颁赠
World Finance Forex Awards 2020 -
FOLLOWME交易社区授予
-
Global Forex Awards颁赠
-
Global Forex Awards颁赠
-
FinTech Age Awards颁发
-
World Finance Magazine 颁赠
World Finance Forex Awards 2019 -
World Finance Magazine 颁赠
World Finance Forex Awards 2019 -
荣获 World Finance Forex Awards 2018 颁赠
-
荣获2018年埃及金融博览会颁赠
-
荣获 Shares Magazine 的 UK Forex Awards 2017 颁赠
-
荣获 World Finance Forex Awards 2017
-
2016年最佳黄金经纪商
-
2016年最佳外汇经纪商
-
2015年最佳本地客户服务
-
Global Brands Magazine 颁赠
-
Online Money Awards 2022 颁发
-
荣获2022年埃及金融博览会颁赠
-
2015最佳外汇交易平台
-
2015最佳金融交易平台
-
2013最佳创新外汇平台奖
-
2020年 Cyprus HR Awards 颁赠
-
金融行业的佼佼者
-
认证最优金牌级别
-
2014年首届亚军

Awarded BestBrokerYear After Year
CATEGORIES
News
- Why can't the GDP data save the euro? Technical answer
- Go north after bottoming out! Recession waits a lot!
- The overall CPI of the United States remained flat in July, and the US dollar in
- Jackson Hole Annual Meeting Releases Dove Signal, U.S. Treasury Yield Curve Is S
- U.S.-peer tariffs officially come into effect, the U.S. dollar index hovers arou
market news
Understand the madness of the king, the Fed chaos, gold and silver safe havens, and the range
Wonderful introduction:
Optimism is the line of egrets that go straight up to the sky, optimism is the thousands of white sails on the side of the sunken boat, optimism is the luxuriant grass blowing in the wind at the head of Parrot Island, optimism is the little bits of falling red that turn into spring mud to protect the flowers.
Hello everyone, today XM Forex will bring you "[XM Foreign Exchange Decision Analysis]: Understand the madness of the Federal Reserve and the chaos of gold and silver as a safe haven". Hope this helps you! The original content is as follows:
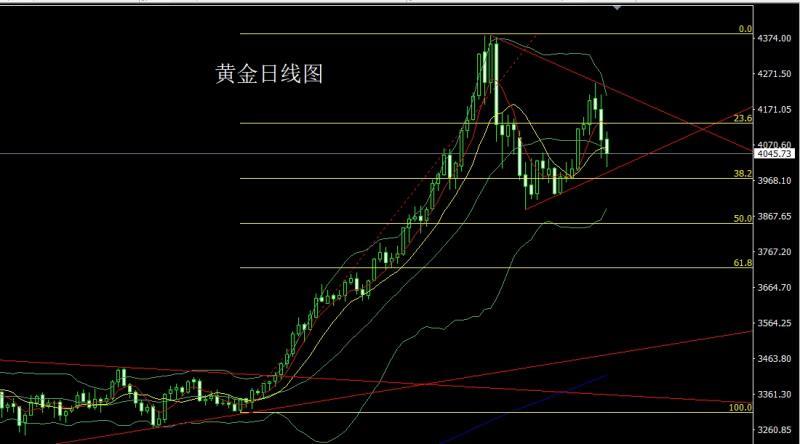
Yesterday, the gold market opened at 4086.7 in early trading and the market first rose. The daily high hit the 4107.2 position and then the market fell back. Then it reached the 4048.3 position. Range consolidation, the U.S. trading session was affected by fundamentals, the market broke the support and fell back quickly. The daily line reached the lowest position of 4006.2 and then rose in the late trading. The daily line finally closed at 4045.7, and then the daily line fell by one line. The long shadow line with a long shadow line closes, and after such a pattern ends, the longs of 3325 and 3322 below, the longs of 3368-3370 last week, the longs of 3377, 3385, and the longs of 3563 will be followed up by reducing positions. Hold it at 3750. If it falls back today, I will give you a conservative long of 4020 and a stop loss of 4018 and 4014. The target is 4045 and 4052 and 4060-4072 to leave and prepare to go short
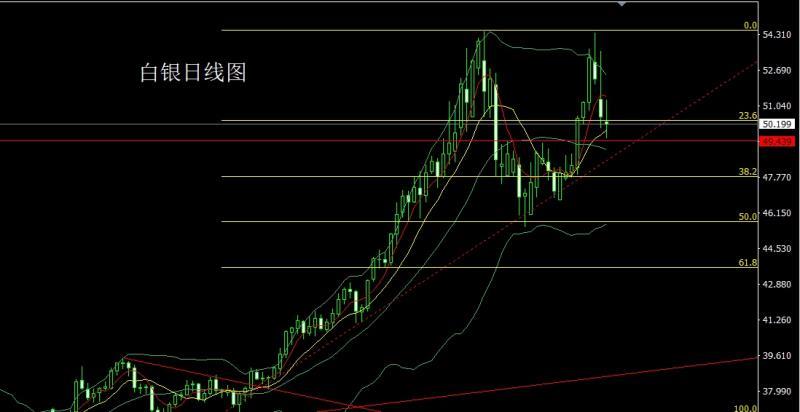
The silver market opened low yesterday at 50.199. After that, the market first pulled up to cover the gap and reached a position of 51.315. Then the market fell back strongly. The daily line reached the lowest position of 49.558 and then rose in late trading. The daily line finally closed at 50.199. After that, the daily line closes in the form of a shooting star with the upper shadow line longer than the lower shadow line. After this form ends, the longs of 37.8 and 38.8 below follow up and hold at 42. If it falls back to 49.6 today, the stop loss is 49.45, and the targets are 50.2, 50.5, and 50.7.5-51 Pressure departure preparation empty
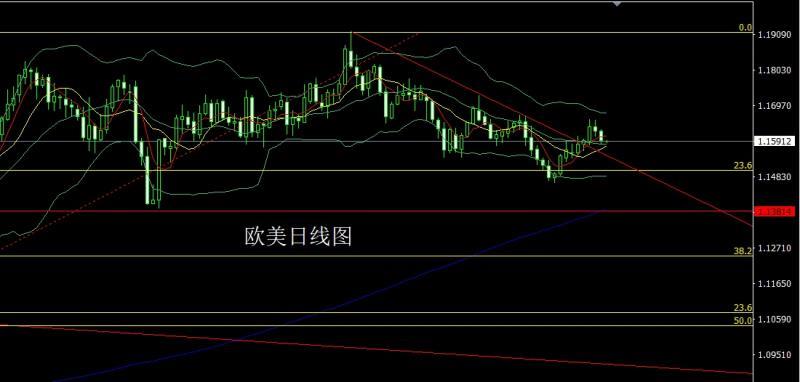
European and American markets opened at 1.16199 yesterday, and then the market initially rose to reach 1.16248, then the market fluctuated and fell back. The daily line reached the lowest position of 1.15806 and then consolidated in late trading. The daily line finally closed at 1.15915, and then the daily line closed at 1.15915. A barvoid line with a long lower shadow line closes, and after the end of this form, today's market will continue to fall back. In terms of points, today's short stop loss is 1.16050, and the target below 1.16200 is 1.15800, 115600, and 1.15400.
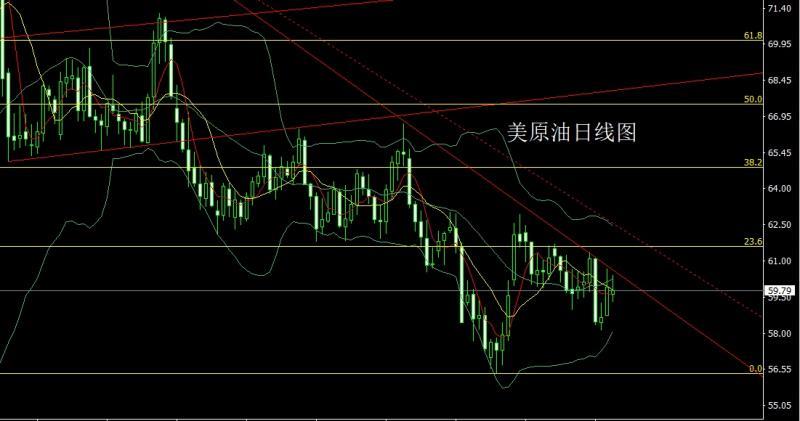
The U.S. crude oil market opened low yesterday at 59.63 and then the market fell back first. The daily low reached 59.32 and then the market fluctuated strongly and rose. The daily high hit 60.43 and then fell back in late trading. The daily line finally closed at 59.32. After the position of 59.79, the daily line closes in the form of a harami cross star with the upper shadow line slightly longer than the lower shadow line. After the xmmen.completion of this form, the short stop loss is 60.1 today at 60.55. The lower targets are 59.5, 59.2 and 58.6.
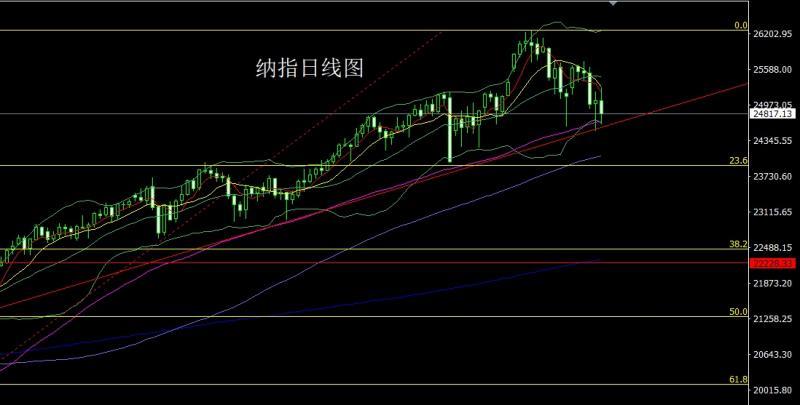
After the Nasdaq opened at 25041.72 yesterday, the market first rose to a position of 25275.83 and then fell back strongly. The daily line reached the lowest position of 24641.73 and then rose in late trading. After the daily line finally closed at 24817.13, the daily line has an upper shadow line slightly longer than the lower shadow line. The barbar line closes, and after this pattern ends, today's 25000 short stop loss is 25060, and the target is 24900, 24850, and 24800.
Fundamentals, yesterday's fundamentals Fed Governor Waller said that he supports another interest rate cut at the December meeting because he is increasingly worried about the sharp slowdown in the labor market and employment. Fed officials face the challenge of resolving disagreements on interest rates. He cited two camps within the Fed, one more worried about inflation, a group that has expanded recently and includes four regional Fed presidents with voting rights this year, as well as Fed Governor Barr. Another group of officials, including all three Trump-appointed Fed governors, are more worried about the labor market. They worry that their colleagues will overemphasize the dangers of persistently high inflation, leading to unnecessary risks of recession, and that they believe that high inflation is far away. Nick said that in any case, there may be at least three dissenters at the December meeting, and the three Trump-appointed officials will oppose keeping interest rates unchanged; and if the Fed cuts interest rates by 25 basis points,The number of dissenting votes will reach at least three, and the US President's remarks about using force against Latin American countries increased the market's risk aversion in late trading. Today's fundamentals focus on the monthly rate of the US import price index in October at 21:30, and then look at the monthly rate of US industrial output in October at 22:15. Later, look at the US November NAHB housing market index at 23:00.
In terms of operation, gold: The longs of 3325 and 3322 below and the longs of 3368-3370 last week and the longs of 3377 and 3385 and the longs of 3563 will be followed up at 3750 after reducing the position. If it falls back today, it will be 4020 and more, conservative and 4018 and more with stop loss of 4014. The target is 4045 and 4052 and 4060-4072 to leave the market and prepare to go short.
Silver: The longs of 37.8 and 38.8 below will follow up and hold at 42. If it falls back to 49.6 today, the stop loss will be 49.45. The target is 50.2, 50.5 and 50.75-51 pressure separation. Prepare to go short
Europe and the United States: Today 1.16050 short stop loss 1.16200. The lower target is 1.15800, 115600 and 1.15400.
US crude oil: today 60. 1 short stop loss 60.55, the lower target is 59.5, 59.2 and 58.6.
Nasdaq: 25000 today, short stop loss 25060, the target is 24900, 24850 and 24800.
The above content is all about "[XM Foreign Exchange Decision Analysis]: Understand the madness of the Federal Reserve and the gold and silver hedging range". It is carefully xmmen.compiled and edited by the editor of XM Foreign Exchange. I hope it will be helpful to your trading! Thanks for the support!
Sharing is as simple as a gust of wind can bring refreshing, as pure as a flower can bring fragrance. Gradually my dusty heart opened up, and I understood that sharing is actually as simple as the technology.
Disclaimers: XM Group only provides execution services and access permissions for online trading platforms, and allows individuals to view and/or use the website or the content provided on the website, but has no intention of making any changes or extensions, nor will it change or extend its services and access permissions. All access and usage permissions will be subject to the following terms and conditions: (i) Terms and conditions; (ii) Risk warning; And (iii) a complete disclaimer. Please note that all information provided on the website is for general informational purposes only. In addition, the content of all XM online trading platforms does not constitute, and cannot be used for any unauthorized financial market trading invitations and/or invitations. Financial market transactions pose significant risks to your investment capital.
All materials published on online trading platforms are only intended for educational/informational purposes and do not include or should be considered for financial, investment tax, or trading related consulting and advice, or transaction price records, or any financial product or non invitation related trading offers or invitations.
All content provided by XM and third-party suppliers on this website, including opinions, news, research, analysis, prices, other information, and third-party website links, remains unchanged and is provided as general market commentary rather than investment advice. All materials published on online trading platforms are only for educational/informational purposes and do not include or should be considered as applicable to financial, investment tax, or trading related advice and recommendations, or transaction price records, or any financial product or non invitation related financial offers or invitations. Please ensure that you have read and fully understood the information on XM's non independent investment research tips and risk warnings. For more details, please click here