


Trusted by over 15 Million Traders
The Most Awarded Broker
for a Reason
Easy Access to 1,400+ Global Assets
EURUSD
Euro vs U.S. Dollar
US500
S&P 500 (US500)
GOLD
Gold
COFFEE
US Coffee
Apple
Apple (AAPL.OQ)
-

Finance Magnates 颁发
-

Finance Magnates 颁发
-

Capital Finance International Magazine (CFI.co) 2024年颁赠
-

COLWMA 2024年颁赠
-

荣获World Finance Forex Awards 2023最佳外汇客户服务奖
-

荣获World Finance Forex Awards 2023欧洲最佳外汇经纪商奖
-

荣获World Finance Forex Awards 2023澳大拉西亚最佳外汇经纪商奖
-

荣获World Finance Forex Awards 2023拉丁美洲最佳外汇经纪商奖
-

荣获World Finance Forex Awards 2023中东最佳外汇经纪商奖
-

CFI.co于2023年颁赠
-

荣获2023年City of London Wealth Management Awards
-

荣获2022年埃及金融博览会颁赠
-

荣获2022年City of London Wealth Management Awards
-

CFI.co于2022年颁赠
-

荣获Global Forex Awards 2022 — 零售外汇 颁赠
-
2021年迪拜外汇博览会获颁赠
-

Ultimate Fintech 2021年颁赠
-

荣获2021年City of London Wealth Management Awards
-

FX168于2020年12月颁赠
-

荣获Global Business Awards 2020
-

荣获2020年City of London Wealth Management Awards
-

Capital Finance International Magazine (CFI.co)颁赠
-

Capital Finance International Magazine (CFI.co)颁赠
-

荣获2019年City of London Wealth Management Awards
-

Shares Magazine 授予 UK Forex Awards 2018
-

Capital Finance International Magazine (CFI.co)颁赠
-

Capital Finance International Magazine (CFI.co)颁赠
-

2017年伦敦财富管理奖
-

2016最佳本土 客户服务
-

中东和北非地区(MENA)增长最快的经纪商
-
2015年最佳外汇科技提供商
-
2014年最佳外汇科技提供商
-

2014年最佳外汇科技提供商
-

荣获 The Trading Show 2024年非洲 Africa Fintech 峰会颁赠
-

荣获2024年中东地区 Brokersview 颁赠
-
荣获2024年中东地区 Brokersview 颁赠
-

荣获2024年阿曼 Smart Vision 峰会颁赠
-

荣获2024年迪拜外汇博览会颁赠
-

荣获2024年迪拜 Forex Traders Summit 颁赠
-

2024年埃及 Smart Vision 峰会颁赠
-

投查查于2024年颁赠
-

Capital Finance International Magazine (CFI.co) 2024年颁赠
-

CFI.co于2023年颁赠
-

CFI.co于2023年颁赠
-

交易社区平台FOLLOWME于2022年颁赠
-
2022年迪拜Forex Expo获颁赠
-
2022年迪拜Forex Expo获颁赠
-

荣获Global Forex Awards 2022 — 零售外汇 颁赠
-

CFI.co于2022年颁赠
-

CFI.co于2022年颁赠
-

World Finance Forex Awards 2022 颁发
-

World Finance Forex Awards 2022 颁发
-

World Finance Forex Awards 2022 颁发
-

World Finance Forex Awards 2022 颁发
-
交易社区平台FOLLOWME于2021年颁赠
-

2021年埃及Smart Vision Investment Expo博览会获颁赠
-

CFI.co于2021年颁赠
-

CFI.co于2021年颁赠
-

荣获Global Forex Awards 2021 — 零售外汇 颁赠
-

荣获Global Forex Awards 2021 — 零售外汇 颁赠
-

World Finance 2021颁发
-

World Finance 2021颁发
-
FOLLOWME于2021年颁赠
-

Global Forex Awards 2021 — B2B 颁赠
-

Global Forex Awards颁赠
-

Global Forex Awards颁赠
-

CFI.co于2020年颁赠
-

CFI.co于2020年颁赠
-

荣获Global Business Awards 2020
-

World Finance Magazine 颁赠
World Finance Forex Awards 2020 -

World Finance Magazine 颁赠
World Finance Forex Awards 2020 -
FOLLOWME交易社区授予
-

Global Forex Awards颁赠
-

Global Forex Awards颁赠
-

FinTech Age Awards颁发
-

World Finance Magazine 颁赠
World Finance Forex Awards 2019 -

World Finance Magazine 颁赠
World Finance Forex Awards 2019 -

荣获 World Finance Forex Awards 2018 颁赠
-

荣获2018年埃及金融博览会颁赠
-

荣获 Shares Magazine 的 UK Forex Awards 2017 颁赠
-

荣获 World Finance Forex Awards 2017
-

2016年最佳黄金经纪商
-

2016年最佳外汇经纪商
-

2015年最佳本地客户服务
-

Global Brands Magazine 颁赠
-

Online Money Awards 2022 颁发
-

荣获2022年埃及金融博览会颁赠
-

2015最佳外汇交易平台
-

2015最佳金融交易平台
-

2013最佳创新外汇平台奖
-

2020年 Cyprus HR Awards 颁赠
-

金融行业的佼佼者
-

认证最优金牌级别
-

2014年首届亚军
-
Finance Magnates 颁发
-
Finance Magnates 颁发
-
Capital Finance International Magazine (CFI.co) 2024年颁赠
-
COLWMA 2024年颁赠
-
荣获World Finance Forex Awards 2023最佳外汇客户服务奖
-
荣获World Finance Forex Awards 2023欧洲最佳外汇经纪商奖
-
荣获World Finance Forex Awards 2023澳大拉西亚最佳外汇经纪商奖
-
荣获World Finance Forex Awards 2023拉丁美洲最佳外汇经纪商奖
-
荣获World Finance Forex Awards 2023中东最佳外汇经纪商奖
-
CFI.co于2023年颁赠
-
荣获2023年City of London Wealth Management Awards
-
荣获2022年埃及金融博览会颁赠
-
荣获2022年City of London Wealth Management Awards
-
CFI.co于2022年颁赠
-
荣获Global Forex Awards 2022 — 零售外汇 颁赠
-
2021年迪拜外汇博览会获颁赠
-
Ultimate Fintech 2021年颁赠
-
荣获2021年City of London Wealth Management Awards
-
FX168于2020年12月颁赠
-
荣获Global Business Awards 2020
-
荣获2020年City of London Wealth Management Awards
-
Capital Finance International Magazine (CFI.co)颁赠
-
Capital Finance International Magazine (CFI.co)颁赠
-
荣获2019年City of London Wealth Management Awards
-
Shares Magazine 授予 UK Forex Awards 2018
-
Capital Finance International Magazine (CFI.co)颁赠
-
Capital Finance International Magazine (CFI.co)颁赠
-
2017年伦敦财富管理奖
-
2016最佳本土 客户服务
-
中东和北非地区(MENA)增长最快的经纪商
-
2015年最佳外汇科技提供商
-
2014年最佳外汇科技提供商
-
2014年最佳外汇科技提供商
-
荣获 The Trading Show 2024年非洲 Africa Fintech 峰会颁赠
-
荣获2024年中东地区 Brokersview 颁赠
-
荣获2024年中东地区 Brokersview 颁赠
-
荣获2024年阿曼 Smart Vision 峰会颁赠
-
荣获2024年迪拜外汇博览会颁赠
-
荣获2024年迪拜 Forex Traders Summit 颁赠
-
2024年埃及 Smart Vision 峰会颁赠
-
投查查于2024年颁赠
-
Capital Finance International Magazine (CFI.co) 2024年颁赠
-
CFI.co于2023年颁赠
-
CFI.co于2023年颁赠
-
交易社区平台FOLLOWME于2022年颁赠
-
2022年迪拜Forex Expo获颁赠
-
2022年迪拜Forex Expo获颁赠
-
荣获Global Forex Awards 2022 — 零售外汇 颁赠
-
CFI.co于2022年颁赠
-
CFI.co于2022年颁赠
-
World Finance Forex Awards 2022 颁发
-
World Finance Forex Awards 2022 颁发
-
World Finance Forex Awards 2022 颁发
-
World Finance Forex Awards 2022 颁发
-
交易社区平台FOLLOWME于2021年颁赠
-
2021年埃及Smart Vision Investment Expo博览会获颁赠
-
CFI.co于2021年颁赠
-
CFI.co于2021年颁赠
-
荣获Global Forex Awards 2021 — 零售外汇 颁赠
-
荣获Global Forex Awards 2021 — 零售外汇 颁赠
-
World Finance 2021颁发
-
World Finance 2021颁发
-
FOLLOWME于2021年颁赠
-
Global Forex Awards 2021 — B2B 颁赠
-
Global Forex Awards颁赠
-
Global Forex Awards颁赠
-
CFI.co于2020年颁赠
-
CFI.co于2020年颁赠
-
荣获Global Business Awards 2020
-
World Finance Magazine 颁赠
World Finance Forex Awards 2020 -
World Finance Magazine 颁赠
World Finance Forex Awards 2020 -
FOLLOWME交易社区授予
-
Global Forex Awards颁赠
-
Global Forex Awards颁赠
-
FinTech Age Awards颁发
-
World Finance Magazine 颁赠
World Finance Forex Awards 2019 -
World Finance Magazine 颁赠
World Finance Forex Awards 2019 -
荣获 World Finance Forex Awards 2018 颁赠
-
荣获2018年埃及金融博览会颁赠
-
荣获 Shares Magazine 的 UK Forex Awards 2017 颁赠
-
荣获 World Finance Forex Awards 2017
-
2016年最佳黄金经纪商
-
2016年最佳外汇经纪商
-
2015年最佳本地客户服务
-
Global Brands Magazine 颁赠
-
Online Money Awards 2022 颁发
-
荣获2022年埃及金融博览会颁赠
-
2015最佳外汇交易平台
-
2015最佳金融交易平台
-
2013最佳创新外汇平台奖
-
2020年 Cyprus HR Awards 颁赠
-
金融行业的佼佼者
-
认证最优金牌级别
-
2014年首届亚军

Awarded BestBrokerYear After Year
CATEGORIES
News
- Chinese online live lecture this week's preview
- Trump waved a 35% heavy hammer to Canada, and the Canadian dollar hit a new low
- Copper prices fluctuate at high levels waiting for macro guidance, Chile's expec
- The US dollar index soared in the past two days, and the market price approached
- Avoid industry minefields
market analysis
The daily and weekly resistance of gold lines is suppressed, and the gains and losses of European and American weekly support become the key
Wonderful introduction:
Optimism is the line of egrets that are straight up to the blue sky, optimism is the thousands of white sails beside the sunken boat, optimism is the lush grass that blows with the wind on the head of the parrot island, optimism is the falling red spots that turn into spring mud to protect the flowers.
Hello everyone, today XM Foreign Exchange will bring you "[XM Foreign Exchange]: The daily and weekly resistance of the gold line is suppressed, and the gains and losses of the European and American weekly support become the key." Hope it will be helpful to you! The original content is as follows:
Dollar Index
In terms of the performance of the US dollar index, the US dollar index showed a volatile trend on Wednesday. The price of the US dollar index rose to 98.418 on the day, and fell to 98.055 at the lowest, and finally closed at 98.225. Looking back at the market performance on Wednesday, during the early trading period, the price continued to pierce the weekly and daily resistance, and then the price retreated downward again. From the final closing of the day, the price cross state ended. At present, the US dollar index is a low-level consolidation, and the overall price is still upward after the fluctuation.
From a multi-cycle analysis, the weekly level has recently been supported by the weekly support up and down. This week, the focus is on the 98.30 position to stabilize. Once it stands firm, the medium-term bulls will continue to rise. At the daily level, the price suppressed the daily resistance position last week and continued to fluctuate below the daily resistance position. The current daily resistance is at 98.20, and it is currently fluctuating in this area. We will pay attention to further breakthroughs and rises in the future. From the four-hour perspective, the four-hour period is the key to our emphasis on short-term price trends. Currently, the price is still above 98.20 for the four-hour support, so it is still relatively long for the short term. From an hour's perspective, you can see that you can see that in the short term, you should first pay attention to the support of the 98.10-20 range, and above, pay attention to the 98.60-99 area.
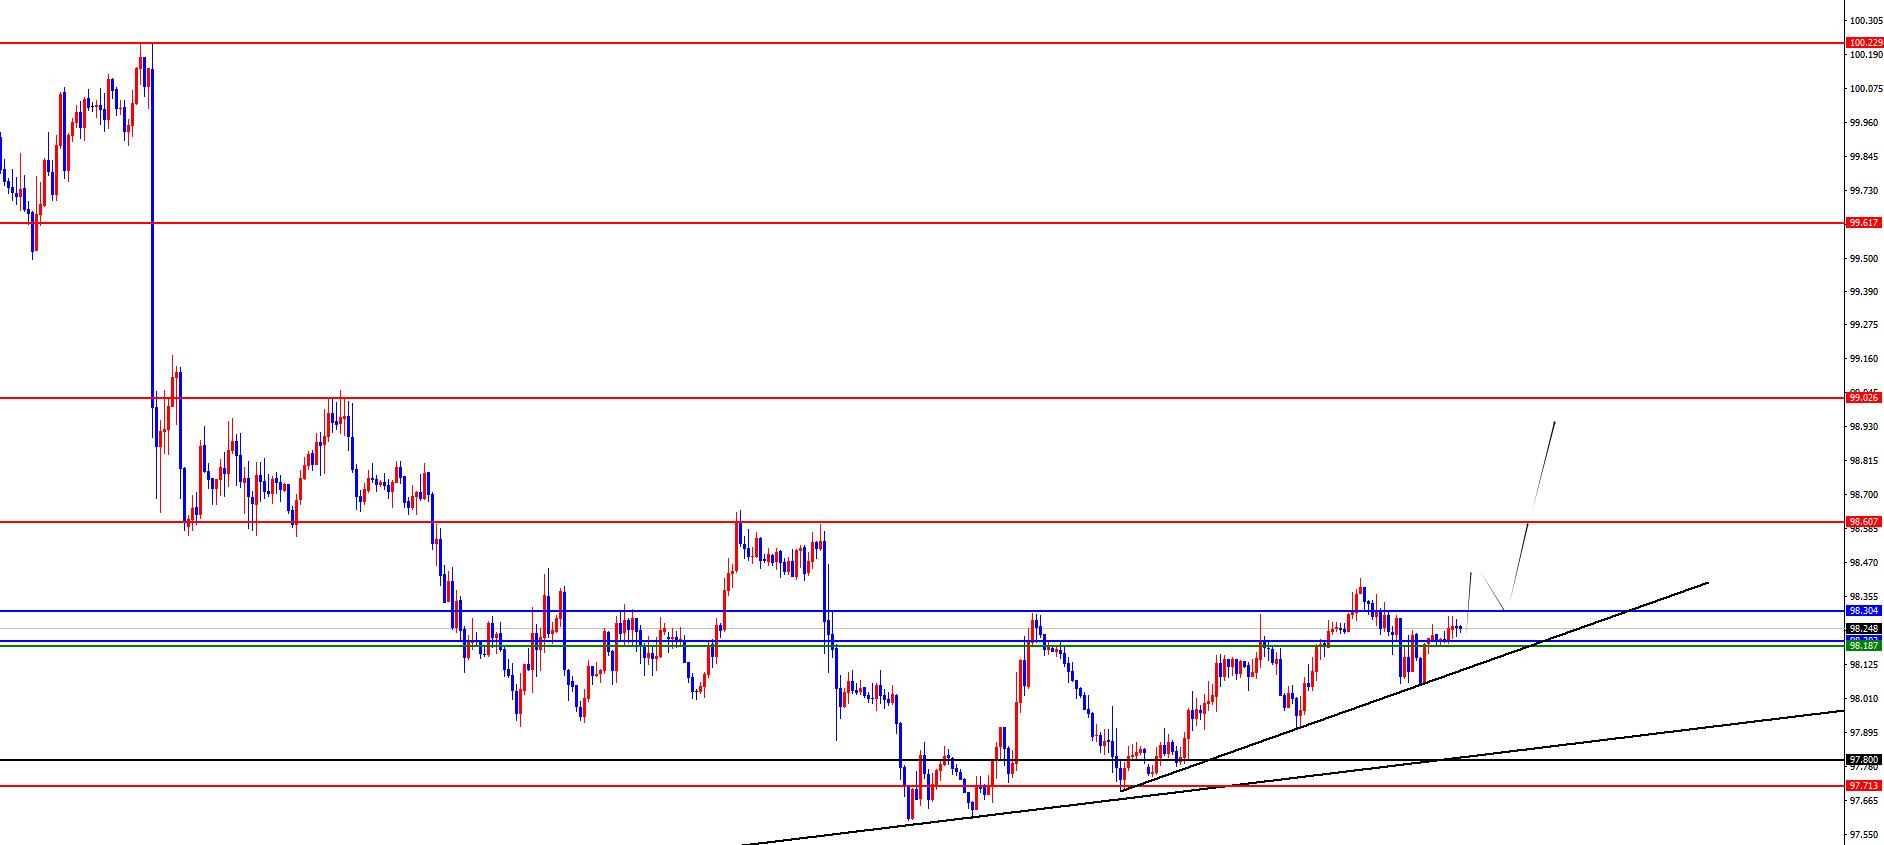
The US dollar index has a long range of 98.10-20, with a defense of 5 US dollars, and a target of 98.60-99
Gold
In terms of gold, the overall price of gold showed an upward trend on Wednesday, with the highest price rising on the day to 330.1, the lowestIt fell to 3311.39 and closed at 3348.04. In response to the continued bottoming out and rebounding during the early trading session of Wednesday, the price continued to rise during the European session, and broke through four-hour resistance before the European session, and continued in the US session. From the same day, the price touched the weekly resistance area. At present, gold focuses on the suppression of the weekly and daily resistance areas. This area is the current short-term long and short watershed gold.
From multi-cycle analysis, first observe the monthly line rhythm. The price will run at the rhythm in May as the author said, and the final cross state. The final price in June is still in an anti-K state. For the current need to pay attention to the gains and losses of the monthly line high and low points, the price will continue to be under pressure after the price breaks the monthly line low point. From the weekly level, the price on the weekly line has been fluctuating in two negative and two positive recent times. Last week was the first week of decline, and this week continues to pay attention to pressure. The weekly long-short watershed position is at 3350. From the daily level, the current daily resistance is at 3355, and the overall daily line is currently bearish, so it continues to be laid out at high altitudes. Four hours is the key to the short-term trend. Yesterday, the price broke through the four-hour resistance position and then reached the weekly resistance position. Therefore, do not chase long for the time being. The 3332 position below is the four-hour long and short watershed. During the morning session of today's one hour, the price first opened higher, and then became weaker again. Overall, the price was under pressure before breaking through the weekly daily resistance. It will continue after falling below the four-hour support. Focus on the 3315-3300 area below.
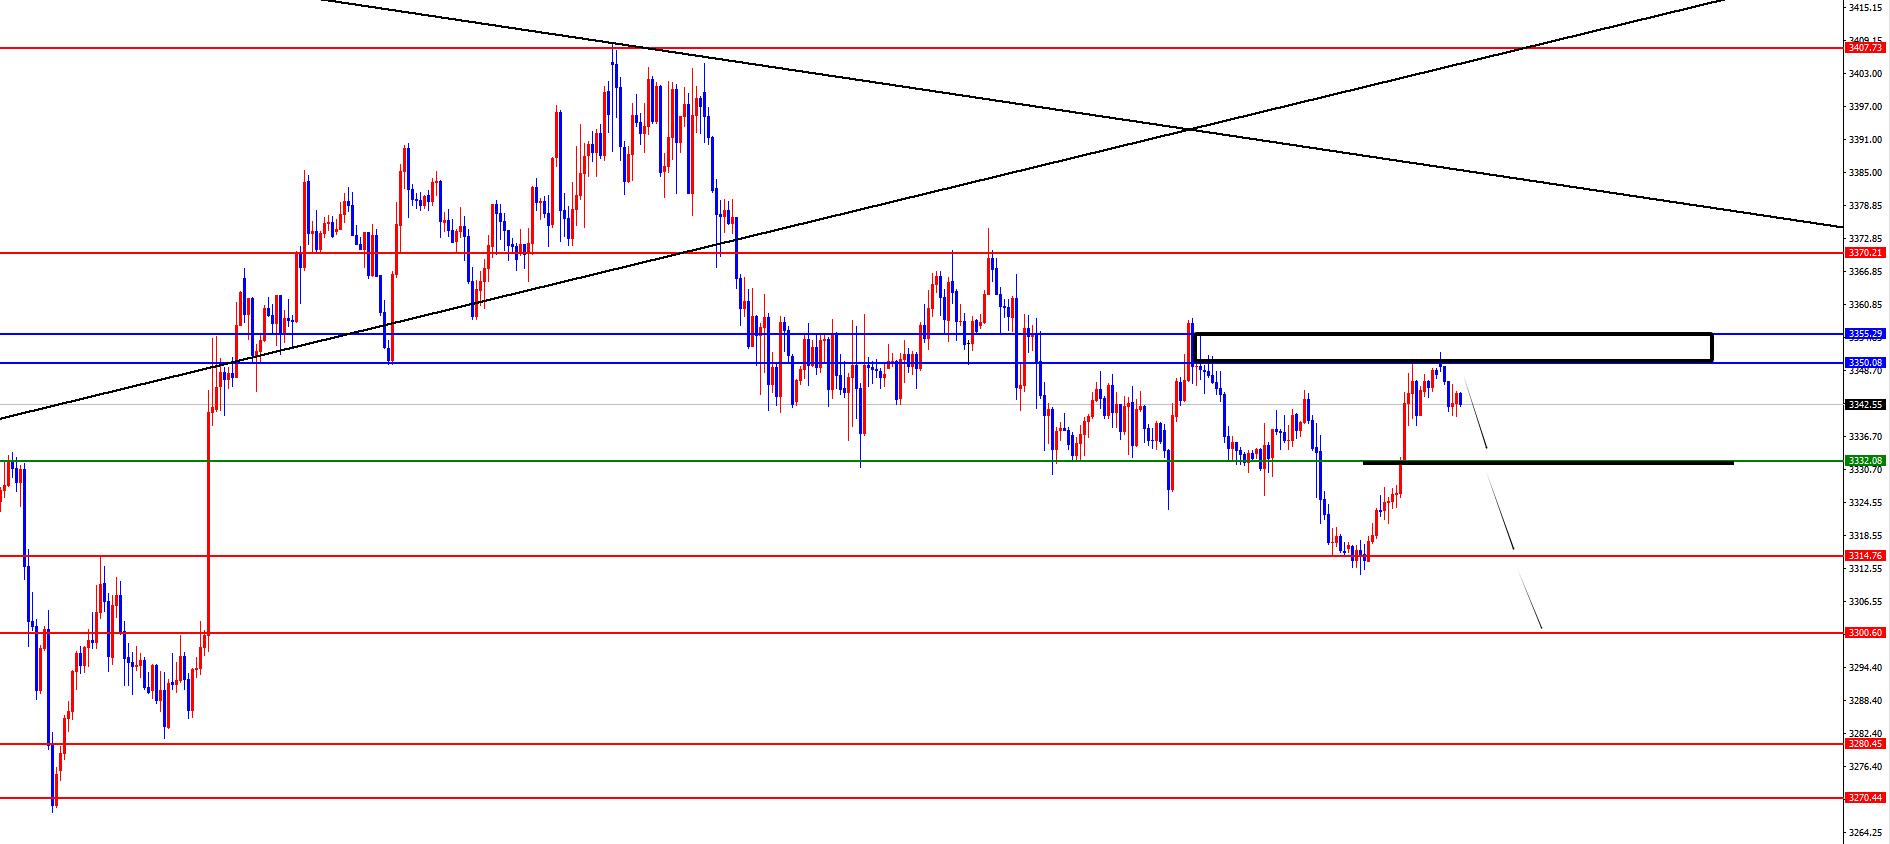
Gold 3350-55 is short in the area, with a defense of US$10, and a target of 3310-3300-3280
European and the United States
European and the United States, the prices in Europe and the United States were generally on Wednesday. The price fell to 1.1621 on the day, and rose to 1.1673 on the highest, closing at 1.1649 on the market. Looking back at the performance of European and American markets on Wednesday, the price in the early trading first went downward first, then rebounded upward, and the price hit the four-hour resistance and then was under pressure. Finally, the daily positive line ended. The current price increase was temporarily treated as a correction, and the subsequent focus was still on pressure, and the weekly support below became the key to the subsequent.
From a multi-cycle analysis, from the perspective of the monthly line level, Europe and the United States are supported at 1.0950, so long-term bulls are treated, and the monthly line ends with a large negative end. Therefore, when you are bullish, you need to pay attention to market adjustments. From the weekly level, the price is supported by the support of the 1.1590 area, and from the perspective of the mid-line, the price decline is temporarily treated as a correction in the mid-line rise. At the same time, it is necessary to pay attention to further retracement in the near future and pay attention to whether it can break down. From the daily level, the current daily resistance at 1.1650 as time goes by, and we will pay attention to further continuous performance in the future. According to the four-hour level, the current four-hour resistance is in the 1.1650-1.1660 area, and we will continue to pay attention to the pressure in the future. The price is currently under pressure,The side continues to pay attention to the gains and losses of weekly support.
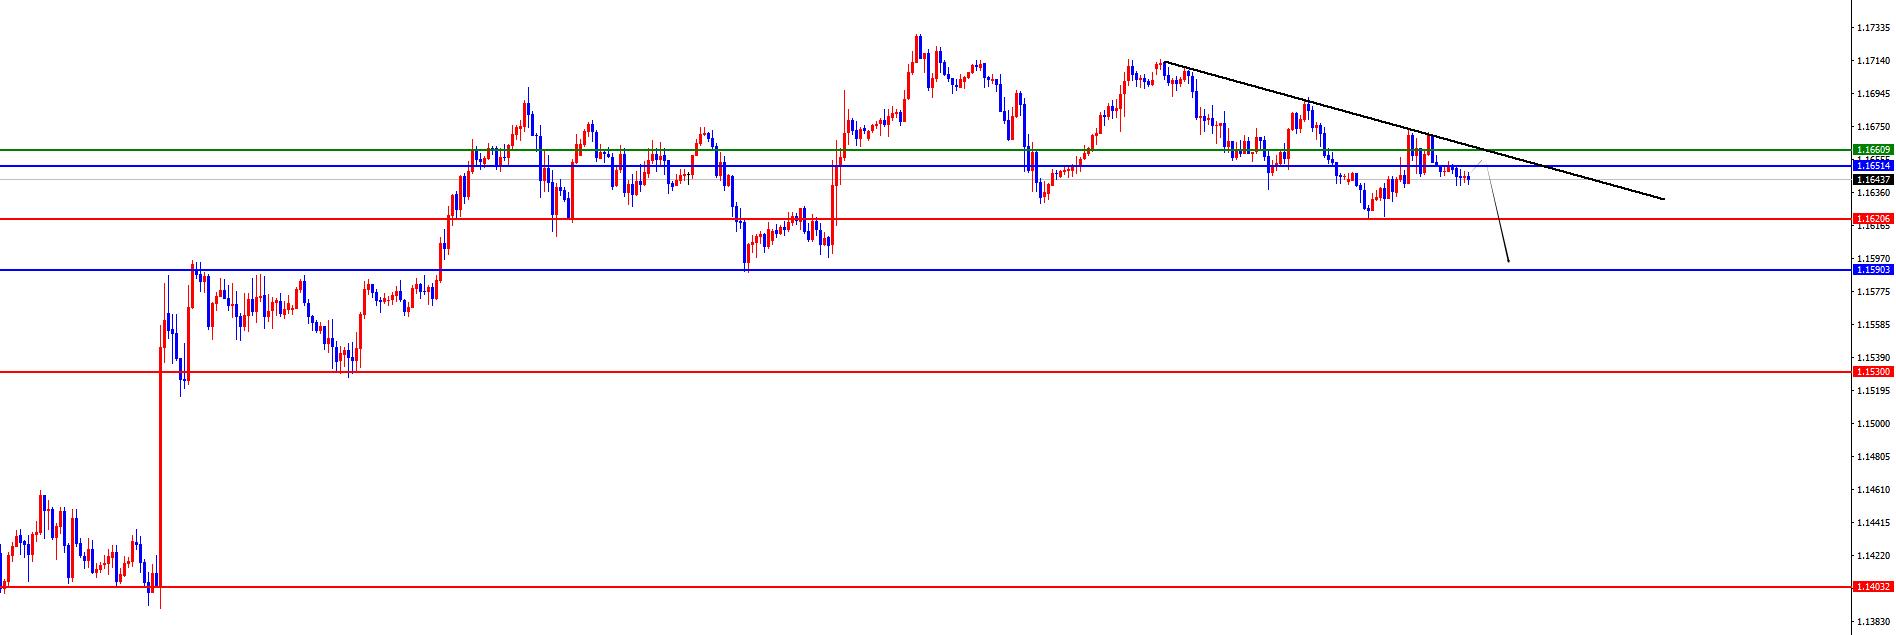
Europe and the United States have a short range of 1.1650-60, defense is 40 points, target 1.1590-1.1530
[Finance data and events that are focused today] Thursday, August 21, 2025
① To be determined Jackson Hall Global Central Bank Annual Meeting
②09:00 China's July Swift RMB accounts for a proportion of global payments
③14: 00 Swiss July trade account
④15:15 France’s August manufacturing PMI initial value
⑤15:30 Germany’s August manufacturing PMI initial value
⑥16:00 Eurozone’s August manufacturing PMI initial value
⑦16:30 UK’s August manufacturing PMI initial value
⑧16:30 UK’s August service PMI initial value
⑨18 :00 UK CBI industrial order difference in August
⑩20:30 US initial unemployment claims in the week from August 16
20:30 US Philadelphia Fed Manufacturing Index in August
21:45 US initial S&P Global Manufacturing PMI in August
21:45 US initial S&P Global Services PMI in August
22:00 Eurozone in August Initial value of the vendor confidence index
22:00 The total number of existing home sales in the United States in July was annualized
22:00 The monthly rate of the leading indicator of the United States in July
22:30 The EIA natural gas inventory in the week from the United States to August 15
Note: The above is only personal opinion and strategy, for reference and xmmen.communication only, and does not give customers any investment advice. It has nothing to do with customers' investment, and is not used as a basis for placing an order.
The above content is all about "[XM Foreign Exchange]: The daily and weekly resistance of the gold line is suppressed, and the weekly support of European and American lines becomes the key". It is carefully xmmen.compiled and edited by the editor of XM Foreign Exchange. I hope it will be helpful to your trading! Thanks for the support!
In fact, responsibility is not helpless, it is not boring, it is as gorgeous as a rainbow. It is this colorful responsibility that has created a better life for us today. I will try my best to organize the article.
Disclaimers: XM Group only provides execution services and access permissions for online trading platforms, and allows individuals to view and/or use the website or the content provided on the website, but has no intention of making any changes or extensions, nor will it change or extend its services and access permissions. All access and usage permissions will be subject to the following terms and conditions: (i) Terms and conditions; (ii) Risk warning; And (iii) a complete disclaimer. Please note that all information provided on the website is for general informational purposes only. In addition, the content of all XM online trading platforms does not constitute, and cannot be used for any unauthorized financial market trading invitations and/or invitations. Financial market transactions pose significant risks to your investment capital.
All materials published on online trading platforms are only intended for educational/informational purposes and do not include or should be considered for financial, investment tax, or trading related consulting and advice, or transaction price records, or any financial product or non invitation related trading offers or invitations.
All content provided by XM and third-party suppliers on this website, including opinions, news, research, analysis, prices, other information, and third-party website links, remains unchanged and is provided as general market commentary rather than investment advice. All materials published on online trading platforms are only for educational/informational purposes and do not include or should be considered as applicable to financial, investment tax, or trading related advice and recommendations, or transaction price records, or any financial product or non invitation related financial offers or invitations. Please ensure that you have read and fully understood the information on XM's non independent investment research tips and risk warnings. For more details, please click here